New Study: How Facebook Users Engage With Ads


Raise your hand if you feel lost in Facebook ads.
Not just the ad formats and constant changes, but also figuring out what makes some ads work and some ads flop.
You may have a pretty solid idea of what your audience wants from you–whether it’s deep discounts or exclusive access to brand new products.
But even armed with this knowledge, your strategy should change according to how a platform’s users operate.
Think about it–the same customer may be active on Twitter and Facebook, but they expect to see different types of content when scrolling through both feeds.
The truth is, customer expectations change from platform to platform.
How do you keep up? It’s simple. You need to know how your customers use Facebook.
To do that, you have to figure out how Facebook users feel about and interact with ads in the first place, then organize that data and assess what it means for your brand.
OK, so maybe it’s not that simple. But don’t worry, we took care of the hard parts for you. All you have to do now is sit back and learn what parts of our 2017 Facebook Consumer Survey (the first ever!) will alter your Facebook ad strategy for good.
Download the free guide in the link below, or keep reading this post to get a broad overview.
We interviewed 1500 people online, all from the U.S. All respondents reported having a Facebook account (really though, who doesn’t?) and ranged in age from 18-54 years old.
Out of the 1500 respondents, 657 were male and 843 were female.
If you want to know more about how the survey was conducted, here’s all the fine print:
This survey was commissioned by CPC Strategy and conducted by Survata, an independent research firm in San Francisco. Survata interviewed 1500 online respondents between March 14, 2017 and March 15, 2017. Respondents were reached across the Survata publisher network, where they take a survey to unlock premium content, like articles and ebooks. Respondents received no cash compensation for their participation. More information on Survata’s methodology can be found at survata.com/methodology.
Now let’s get on to some key findings for brands and retailers.
47.4% of respondents reported that they were introduced to a new product or brand on Facebook in a 30-day period.
The fact that nearly 50% had been exposed to a product or brand was one thing–but the fact that they could remember it was another.
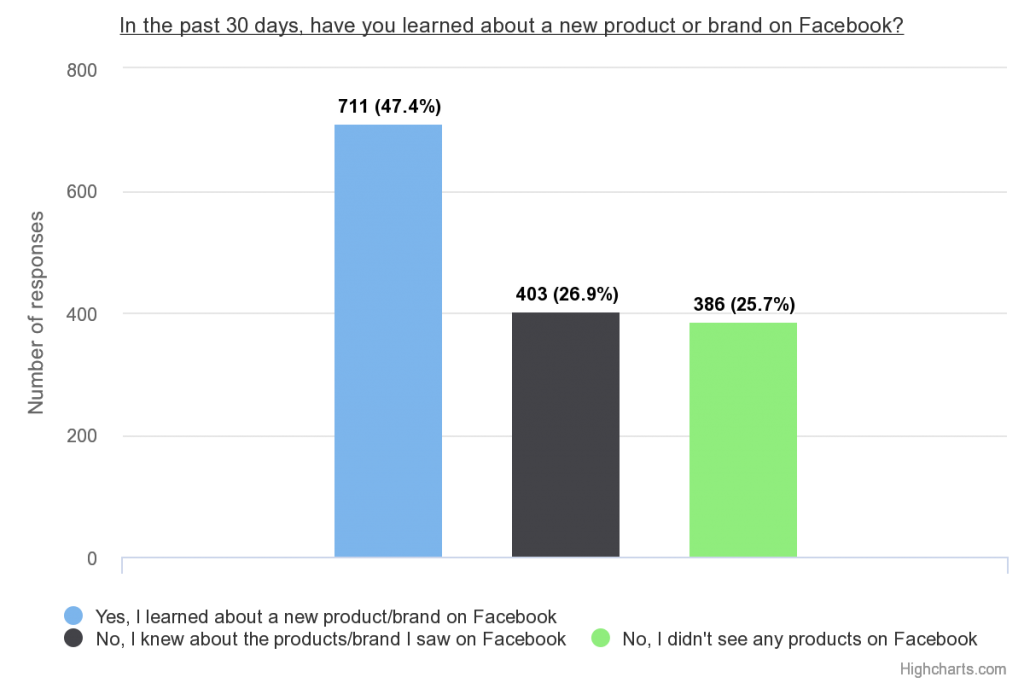
This is fantastic news for brands seeking to be seen and heard. Although we can’t know for sure whether these respondents saw one product or 10, we do know at least one brand or product stuck in their mind. That’s great news for fledgling brands who are seeking visibility.
That’s great news for fledgling brands who are seeking visibility.
While a survey of 1500 may not show the whole story about who’s shopping on Facebook, here are a few of the biggest findings:
While we did have a larger number of female respondents in the survey, we did find that percentage wise, women were more likely than make to purchase products they initially saw on Facebook.
This one’s not shocking–an engaged user is more likely to purchase your product than one who scrolls right past.
Every brand and retailer’s latency period for products will vary, but remember, Facebook is also a prime spot to re-engage people who are familiar with your brand (or have purchased from you before). More on the power of Facebook retargeting later.
In one question, we asked users to rank the reasons they’d follow a brand on a scale of 1-4, with 1 being the most important, 4 being the least.
Here’s how the question appeared:
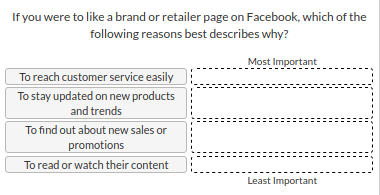
And here’s a ranking of the most popular response order (remember, the closer the number is to 1, the more important it is):
Interestingly, men were more interested in “liking” a brand’s Facebook page for the content, while women reported being more interested in sales and promotions.
54.6% of respondents feel positive or indifferent about ads on the platform.
That high positive engagement is likely due to the quality of many ads on Facebook, as well as the native format. The native format could also explain why 25.7% of respondents claimed they didn’t see any products on Facebook, and 15.3% didn’t notice ads.
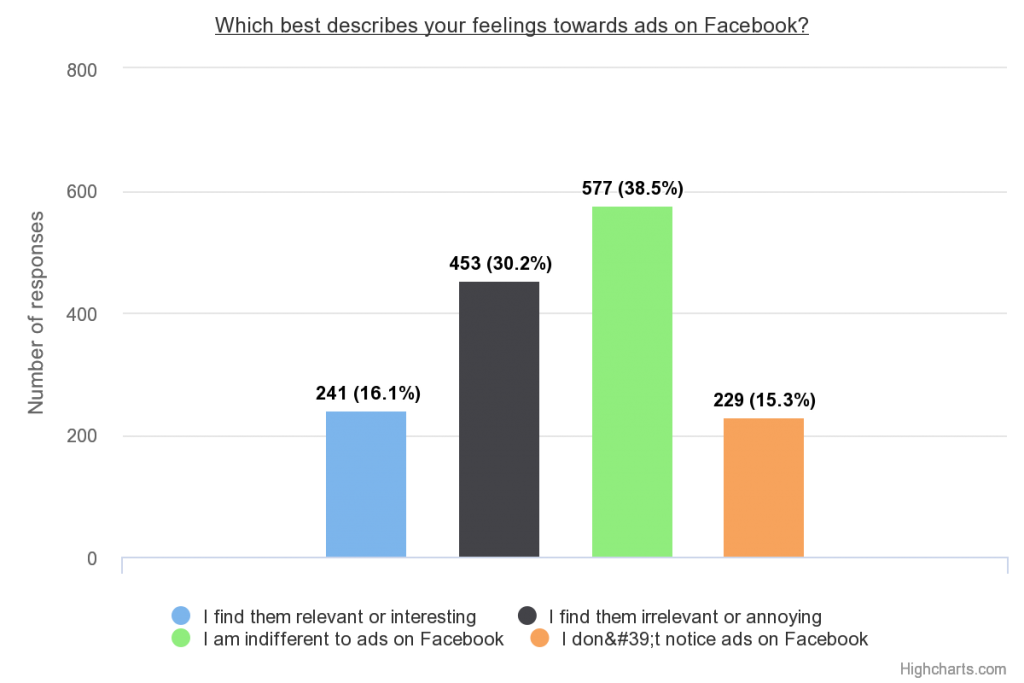
While many internet users resent pop-ups, banners, and other types of disruptive advertising, Facebook is becoming the perfect place to engage and convert. Don’t ruin it for users and other advertisers–make your ads amazing.
There were plenty of other findings in the survey. Things like:
To access the entire study, click the link below: