Ecommerce Analytics: How to Improve Your Ecommerce Sales Funnel


As an ecommerce store owner, you have access to endless customer data and insights. You can learn about your customer with tools like Google Analytics for quantitative data and services like User Testing for qualitative data. Yes despite these opportunities, 80% of online retailers do not collect or use their ecommerce analytics data properly.
If you are serious about increasing your ecommerce conversion rates and growing your business, you need to get serious about collecting and analysing your customer data today.
In this highly practical and actionable post, you’ll discover how to use Google Analytics to learn at which stages visitors are leaving your sales funnel and more importantly, what other tools you can use to learn why they are leaving.
What you’ll cover:
The first step to creating your ecommerce sales funnel in Google Analytics is setting up your goal. Goals are the key tasks you want your visitor to complete on the your website.
For example:
Goals are a way to measure the number of leads and sales a website generates.
Log into Google Analytics, jump into your shop profile, and then click on the admin tab in the main menu at the top of the page.
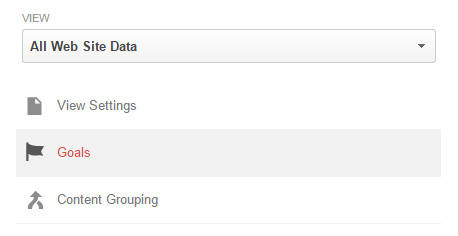
On the right hand side you should see the ‘Goals’ sub menu.
Click on ‘Goals’
If you have no Goals set up your menu will look as below. Click on the red ‘+ New Goal’ button.
Now it is time to choose the relevant goal type, in this instance it is ‘Place an order’.
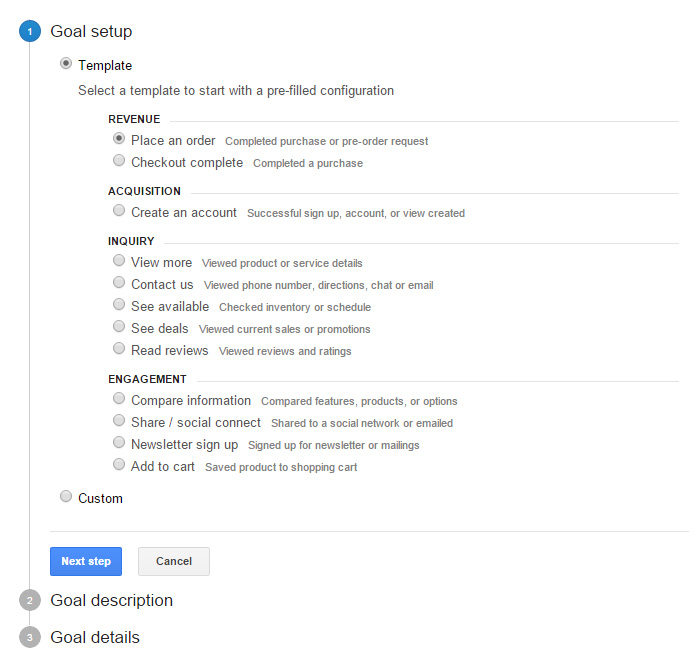
Now click the blue ‘Next step’ button.
Next up, name your goal and leave it checked as ‘Destination’ under type.
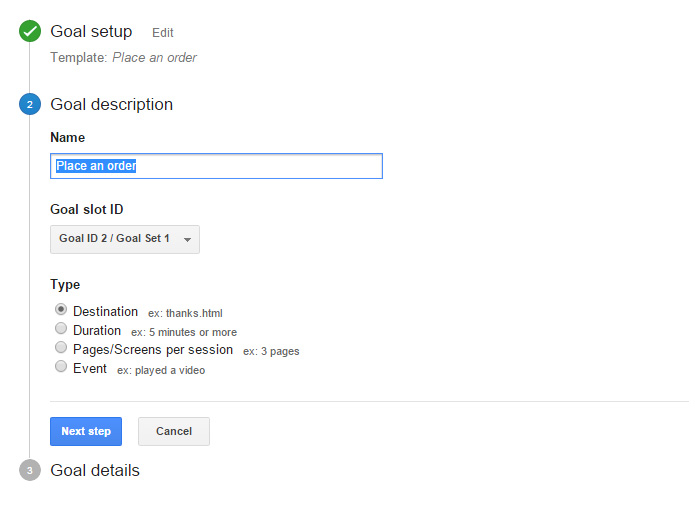
Now click the blue ‘Next step’ button.
In the goal details you need to now reference the destination. This is the page a visitor lands on after they complete their checkout process e.g. the page they go to after they finish buying something on your website.
If you are using the ecommerce platform Shopify, this is more than likely’/checkout/thank_you’ as seen below.
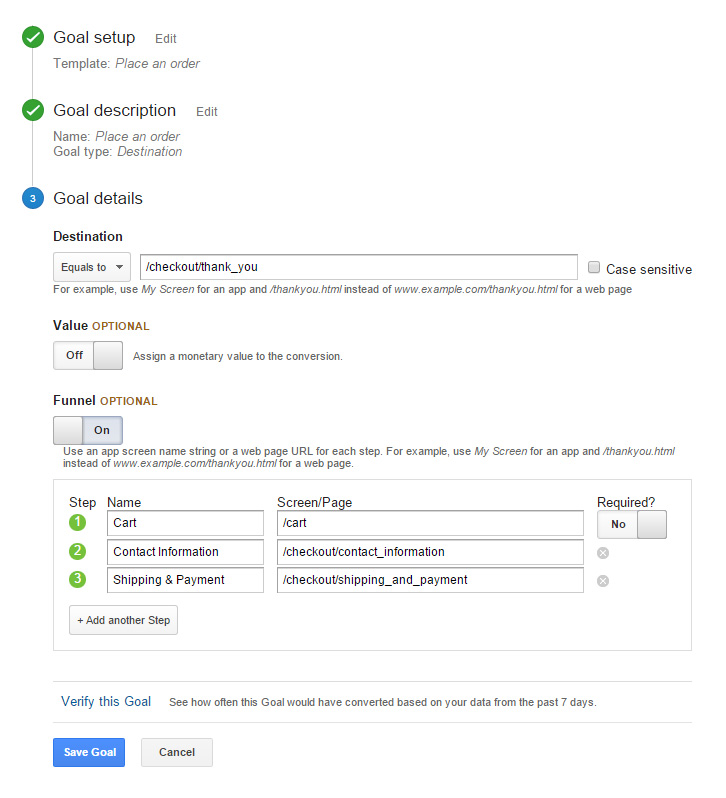
Leave the monetary value turned off.
Turn the funnel optional switch to ‘On’.
Now in the steps you must list the pages and their respective url’s that your visitor goes through during your checkout process. In the case of Shopify, it is as seen in the above screenshot.
Once you’ve included all the relevant steps, click ‘Verify this Goal’ and make sure the percentage is more than 0% (unless your store is brand new and had no sales yet) so you know you got the destination URL correct.
If you roughly know your conversion rate, check to make sure the percentage shown matches your expectations.

Unfortunately Google Analytics cannot create a sales funnel from past data so now you will need to wait at least one whole week (analysis should always been done in full weeks to account for day of the week conversion rates fluctuations) before you can analyse your data.
Once you have set up your goal and sales funnel and collected some data you are ready to gain some insights.
Navigate in your Google Analytics account to:
Conversions > Goals > Funnel Visualization
You should see a report like this.
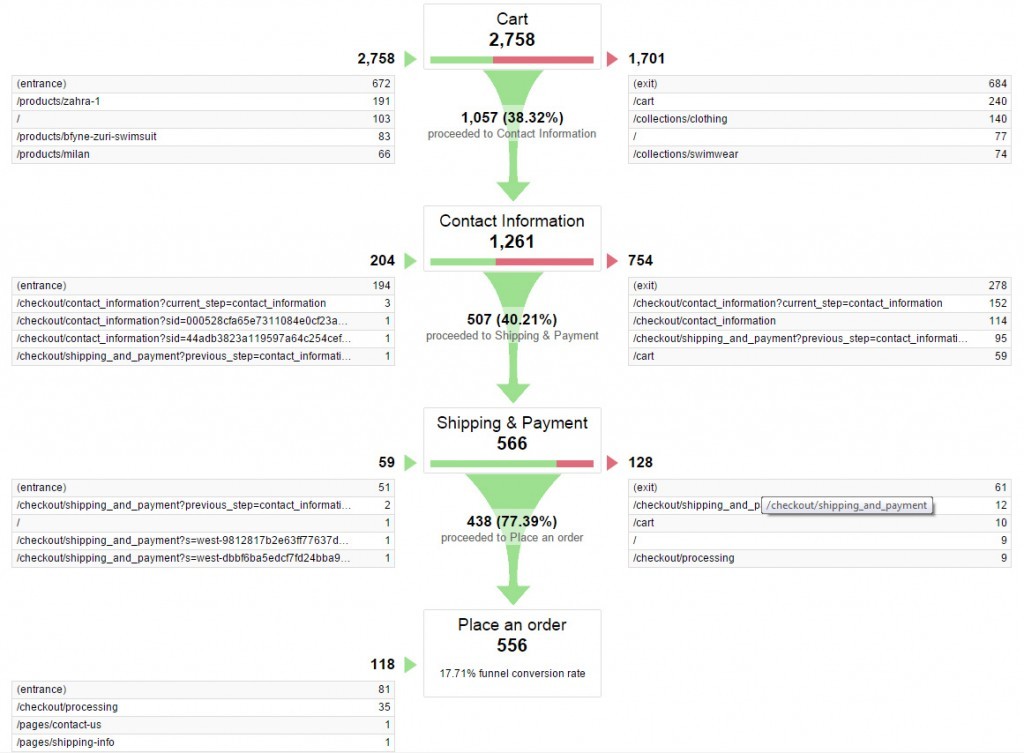
As you can see, each step in your sales funnel from ‘Cart’ to ‘Place an order’ is shown, with the relevant percentage drop off between each step.
The first thing to look for the steps with the longest red lines, these show the steps with the highest exit rates and these will require the most conversion work. In this case the step between ‘Cart’ and ‘Contact information’ has the highest exit rate, 61.68%. Only 38.32% of visitors continue to the next step.
But don’t forget to look closely at the report, as you can see from the 1,701 people who leave the sales funnel at this step only 684 actually leave the website.Below ‘(e xit)’ you can see that users also click on the cart page, go back to shopping in collections, etc.
Actually only 24.8% of these visitors abandon the website completely, which is why I prefer to use the ‘Goal Flow’ report.
Navigate in your Google Analytics account to:
Conversions > Goals > Goal Flow
You should see a report like this.
As you can see when we hover on the red arrow in your ‘Goal Flow’ report you get a detailed break down with percentage for where visitors are leaving to and a more accurate and easily accessible exit rate.
The numbers will be slightly different as Goal Flows does not include backfilling.
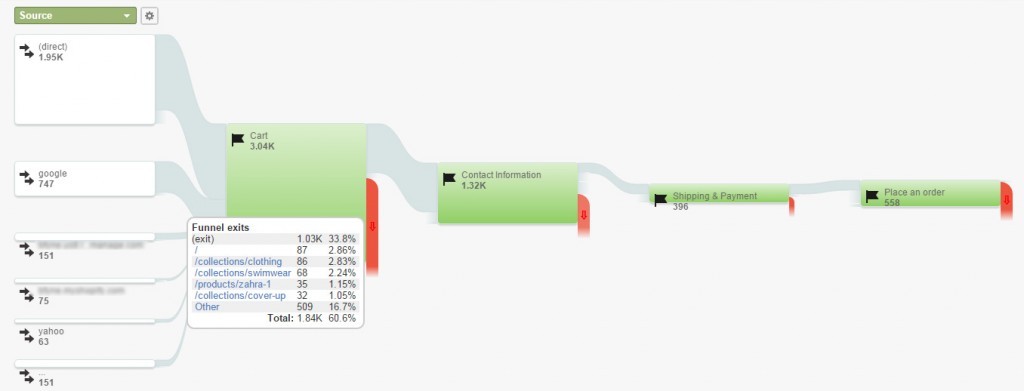
I advise to use this report exclusively. Other than a more detailed exit report, you can also do multiple types of segmentation when looking at the data. This includes:
Once you’ve learned which steps in the sales funnel the majority of visitors leave from, it is time to learn why. You can do this by collecting other data types and cross referencing it with the Google Analytics data.
The key is to learn about the motivations, desires and needs of your visitors. If you can understand for example, their reservations to buying from you, you can address those reservations with better copywriting and increase conversions.
Another example would be:
You can collect mouse tracking data using a tool like Heat Maps, for example. As you would expect, mouse tracking software tracks your visitors cursor/mouse pointer behavior, effectively identifying the most engaging aspects of your online store.
There are three main types of mouse tracking data you can capture and use in order to improve your ecommerce store.
You can study your mouse tracking data, as seen in the example below, and look for certain clues:
![]()
This way you can learn what users are clicking that they shouldn’t be and remove that element, removing distractions from the path to conversion along the sales funnel.
You can also learn if users are clicking an image thinking it is an icon, and make the links and images more distinct in your design to reduce confusion.
There are of course many other types of data you can collect and analyse to learn why visitors are leaving the sales funnel at certain pages. These include:
Cross referencing these qualitative data sources alongside your funnel reports will bring about the biggest learning and conversion lifts.
Remember, conversion optimization is not about A/B testing or increasing what percentage of people click a button – it’s about improving the profitability of you overall business.
If you were solely interested in increasing conversion rates, you could just reduce all your prices to $1. Increasing profits is what you are interested in when optimizing your shop’s conversion rates. Make sure to collect data from qualitative and quantitative sources and cross reference them for the biggest learnings.
Analytics can only take you so far, you will always need to know ‘why’ to get the conversion rate increase you want and need for explosive success.